10.12 from the Lunar Sourcebook by G.H. Heiken, D.T. Vaniman, and B.M. French, editors,
copyright 1991 by Cambridge University Press, and is reproduced with
permission. It is dervied from the 1978
air-brush map of the Defence Mapping Agency and
the US Geological Survey.
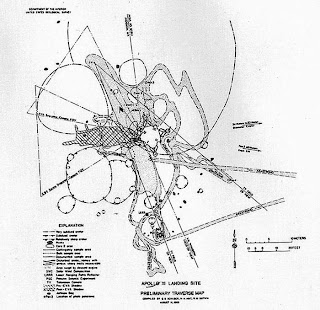
Landing site map visualization: SIMPLE AND EFFECTIVE. Diagram based on the Apollo 11, 12, and 14 Traverses map prepared by the U.S. Geological Survey and published by the Defense Mapping Agency for NASA.
Same as above, with more annotation. Traverse Map, Figure 3-16 from the Apollo 11 Preliminary Science Report
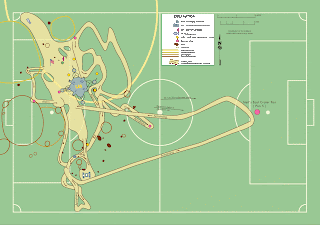
Now this is art. At the suggestion of Joe O’Dea, Thomas Schwagmeier has created an overlay of his Apollo 11 traverse diagram on a football (soccer) pitch. Spatially correct, not less complicated and still visually effective (but not very scientific). Size context is given, Lunar context is lost, however. So this may be more art than science. Designed for international audience.
Oops... Americans don't know how large a football field is... so there is a need for a localized version for the American audience. The same problem arises when spacecraft images are compared to coutry/state contours.
Thomas Schwagmeier used a detail from the 5 November 2011 LROC image taken from 25-km altitude to revise his Apollo 11 traverse diagram overlayed on a baseball diamond, based on a suggestion by Eric Jones. Lunar context is now back but all annotation has disappeared.
So, nothing is good for me, but from these figures, a good one could be combined.
Source: http://history.nasa.gov/alsj/a11


No comments:
Post a Comment